


P&K ODOR
Graphical Illustrations
Product has been archived / Produkt wurde archiviert
Characteristics graphic and area map
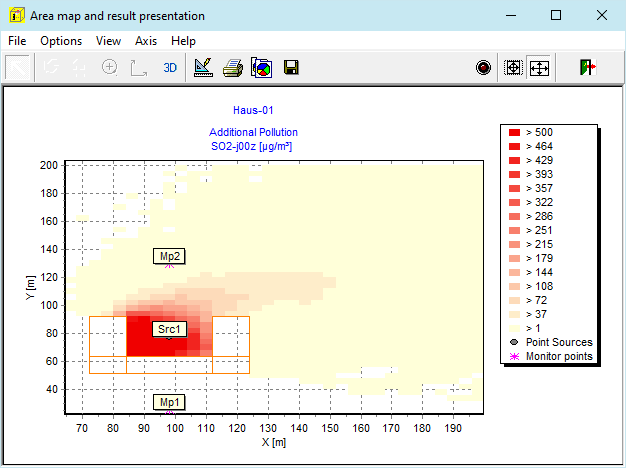
In this part of the program the characteristics and the area map can be illustrated. In the menu "Options" several forms can be opened. The form Characteristic is to control the graphics and to define the title. It can be opened by a mouse click onto the graphic title. In the form Area map, settings for the illustration of the sources and evaluation areas can be made. In the form Background Image, e.g. a map can be defined and the appearance of the colored shapes can be modified in the form Shape Attributes.
The menu "axis" contains forms for the horizontal axis and the vertical axis as well as a form for the Ordinate. These forms can also be opened by a mouse-click on the corresponding axis or the legend.
In case, no values are displayed, check the Ordinate Settings (e.g. Number of Decimals) and make sure the proper table is selected. Other reasons are to many symbols (Area map) or too tiny shapes (Shape Attributes).
Gaps in the colored shape illustration can mostly be closed by dragging the image a little or changing the windows size. The gaps are a result of roundings; regarding this, we are in contact with the graphic software developer. The gaps can also be controlled in the form Shape Attributes. Also axis scale factors should be kept equal.
For holes in the colored shape illustration, see Thresholds rounded in Configuration of the ordinate.
Zooming
Most of the illustrations can be zoomed; therefore a rectangle has to be opened with the mouse from the upper left corner to the lower right corner. To reset the zoom, a rectangle from the lower right corner to the upper left corner has to be opened with the mouse.
Panning
The graphic can be moved; therefore the graphic is to be dragged with the right mouse button down.
The button  has to be down for all functions, which are activated by clicking into the drawing area.
 MAX
MAX
With the button MAX the scale settings are maximized. The settings in horizontal axis and vertical axis will be altered!
 ISO
ISO
The graphic can be illustrated isometrically by using the button ISO. This has to be repeated after changing the size of the graphic. The settings in horizontal axis and vertical axis will be altered!
3D
The button 2D toggles between 2D and 3D mode. The three-dimensional illustration is only for analysis purpose and not really meaningful for a documentation.
 Print
Print
If the button is available and pressed and the graphic is not in 3D mode, then the form Scaled Printing will be opened, else a preview and setup dialog will be opened, in which printer settings and layout can be modified and the print can be initiated.
Coordinates
Under the menu view, coordinates can be switched on. This displays the current cursor position in the upper right corner.
 Rotate,
  Move,
Move,  Zoom and
  Depth
Depth
These buttons turn the graphic into 3D-mode. These functions are only for analysis purpose.
Clipboard and Export Formats
With the button  Copy, the graphic can be copied to the clipboard. The graphic is then available to be pasted into other windows programs. The graphic can be copied in different formats:
- In the Bitmap format, every pixel of the image is copied. This can be pasted in almost every program, but when scaling it, the results may be unsatisfactory.
- In Meta file format, lines are stored as vectors and are therefore scalable.
The graphic format can be set in  Edit/Chart/Export.
 Reuse Series
If pressed, series which are used to display data, are being reused. This is useful, when loading configurations under the menu File / Configuration, because changes made to properties of a series will persist. See
Setup (Layout, Export and Format)
A form in which more graphic parameters can be set. Functions for export and graphics formats are also in this form.
Modifications made in will not be saved automatically. In some illustrations it might be possible to save and load configuration changes under the file menu, but it might cause strange effects, because the configuration might not fit to the current illustration. Series, which are not needed in the current illustration and which are not automatically destroyed can be made inactive. Data are managed in so called Series. The configuration can be saved with or without data. The data are normally replaced with the current ones, despite this, sometimes it might still be important to save the data along with the configuration.
Modifications and settings in other forms or of the calculated data can overwrite made changes in Setup!
iIt is recommended to set the graphic type to the configuration to be loaded.