


P&K 3950
Symbols
Product has been archived / Produkt wurde archiviert
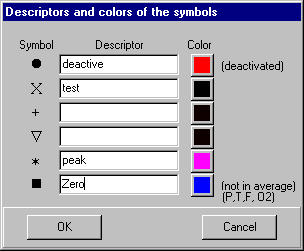
Every data set can be assigned to a Symbol, and hereby categorized. The column S in Measured values dialog is to be used for this task. The Symbols can be named, which will show in the graphic legend and Report.
Data sets assigned to the first symbol are not taken into account. This can be used for Outliers, which are then displayed but not taken into account in calculations.
Data sets assigned to the last symbol are not taken into account in the calculation of the P,T,F and O2 average values in Calculate standard state or state of operation form. This form can be opened via the f(P,T,F,O2) buttons in Characteristics of the measuring system. This symbol is used e.g. for manually entered Null values (not measured value pairs, but added because of the physics) .
Symbol
Sketched symbol of what will be shown in the graphic.
Descriptor
The symbol description appears in the graphic legend and in the tables, if these symbols were linked to measured values. To be shown in the legend, the descriptor must not be empty.
Color
The values in the graphic and in the legend are illustrated with the color of the symbol.
see 2.4 Symbols