P&K 3950
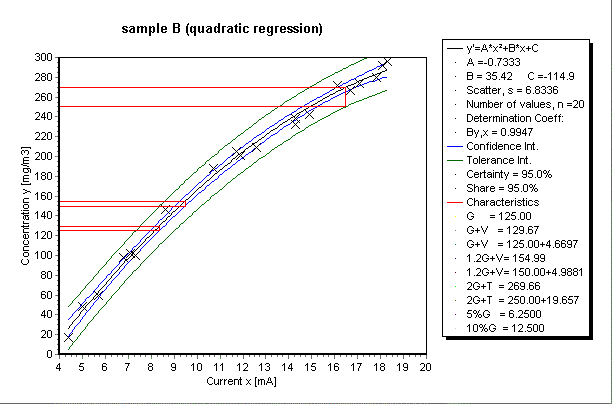
Sample: project B (quadratic regression)
Product has been archived / Produkt wurde archiviert

Input data
| Current | Concentration |
|---|
| [mA] | [mg/m3] |
|---|
| 5.0 | 48 |
| 7.3 | 100 |
| 8.6 | 146 |
| 4.4 | 17 |
| 5.7 | 60 |
| 6.8 | 98 |
| 7.1 | 102 |
| 12.6 | 209 |
| 11.7 | 205 |
| 11.9 | 201 |
| 14.3 | 232 |
| 14.9 | 242 |
| 10.7 | 188 |
| 17.8 | 280 |
| 16.1 | 272 |
| 14.3 | 238 |
| 16.7 | 267 |
| 18.3 | 296 |
| 18.1 | 292 |
| 17.1 | 274 |
Characteristics
Function: y'=A*x²+B*x+C
| Coefficients | | |
| Scatter | s | 6.834 |
| Determination coefficient | | 0.9947 |
| Average value | | |
| Calculated values | | |
List of function values
| x | y' | Confidence interval | Tolerance interval | n' |
|---|
| | | y1 | y2 | y3 | y4 | |
|---|
| 4.4000 | 26.760 | 18.304 | 35.216 | 5.2079 | 48.312 | 2.9091 |
| 5.6636 | 62.195 | 56.180 | 68.210 | 41.914 | 82.476 | 5.7497 |
| 6.9272 | 95.287 | 90.515 | 100.06 | 75.544 | 115.03 | 9.1346 |
| 8.1908 | 126.04 | 121.40 | 130.68 | 106.35 | 145.73 | 9.6750 |
| 9.4544 | 154.45 | 149.45 | 159.44 | 134.62 | 174.28 | 8.3420 |
| 10.718 | 180.52 | 175.22 | 185.81 | 160.56 | 200.47 | 7.4260 |
| 11.982 | 204.24 | 198.95 | 209.53 | 184.28 | 224.20 | 7.4239 |
| 13.245 | 225.62 | 220.66 | 230.59 | 205.81 | 245.44 | 8.4524 |
| 14.509 | 244.67 | 240.22 | 249.12 | 225.05 | 264.29 | 10.509 |
| 15.772 | 261.37 | 257.13 | 265.60 | 241.82 | 280.91 | 11.594 |
| 17.036 | 275.72 | 270.65 | 280.80 | 255.86 | 295.59 | 8.0690 |
| 18.300 | 287.74 | 280.50 | 294.98 | 266.85 | 308.63 | 3.9699 |
Confidence interval:
Valid for 95.0 percentage statistical certainty with table value t(17)= 2.1106
Tolerance interval:
Valid for 95.0 percentage statistical certainty with table value v(17)= 1.4004 and a share (1-gamma)=95.0 % of the entire collective
Function comparison (significance test)
Coefficients and scatter of the function:
| Statement | Function | s | A | B | C |
|---|
| 1 | y'=B*x+C | 14.33 | | 18.50 | -33.12 |
| 2 | y'=A*x²+B*x+C | 6.834 | -0.7333 | 35.42 | -114.9 |
| 3 | y'=B*ln(x)+C | 6.093 | | 192.0 | -270.7 |
| 4 | y'=A*ln²(x)+B*ln(x)+C | 5.678 | 14.87 | 124.8 | -198.2 |
| 5 | y'=B*exp(x)+C | 73.10 | | 2.011E-06 | 160.6 |
| 6 | y'=A*exp²(x)+B*exp(x)+C | 68.04 | -5.733E-14 | 6.405E-06 | 149.1 |
The quadratic regression formula can be assumed as better than the linear one.
| Test value: | 62.128 |
| Table value F(17): | 4.4546 |
| Statistical certainty: | 95% |
Only statement 1 and 2 are compared.
Characteristics / limits
| Name | Factor | Type | Y-value | Y(Type) | delta Y | X |
|---|
| G | 1 | -- | 125 | | | 8.1474 |
| G+V | 1 | +V | 125 | 129.67 | 4.6697 | 8.3466 |
| 1.2G+V | 1.2 | +V | 150 | 154.98 | 4.9881 | 9.4794 |
| 2G+T | 2 | +T | 250 | 269.65 | 19.656 | 16.476 |
| 5%G | 0.05 | -- | 6.25 | | | 3.7037 |
| 10%G | 0.1 | -- | 12.5 | | | 3.9132 |


