


P&K ODOR
Output Samples
Product has been archived / Produkt wurde archiviert
Report-Beispiel
See here for further details about the features of this program part.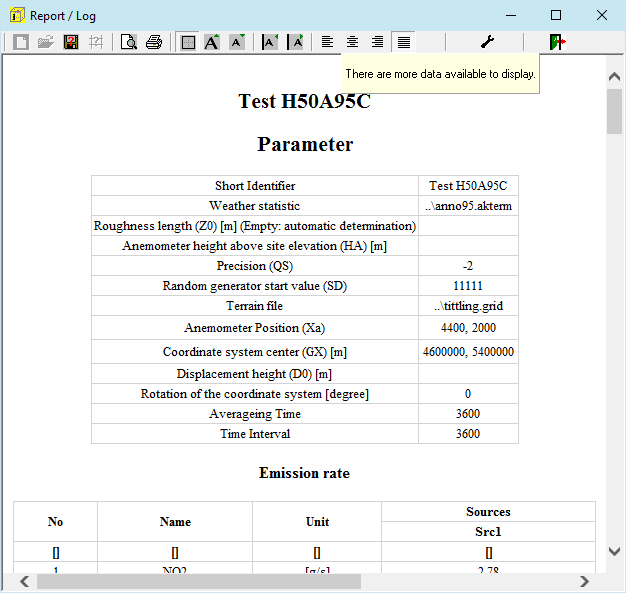
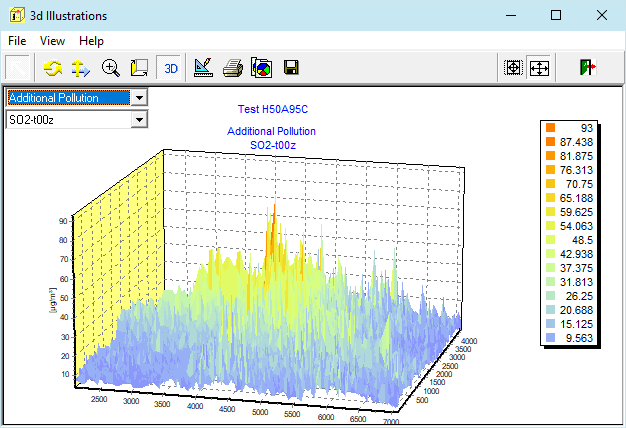
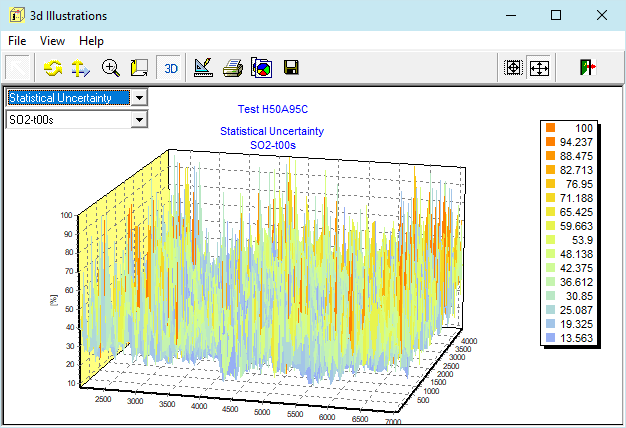
Test H50A95 (not all possible available elements are shown and decoration (logo ...) was added)
Characteristic illustrations for dust
See here for further details about the features of this program part.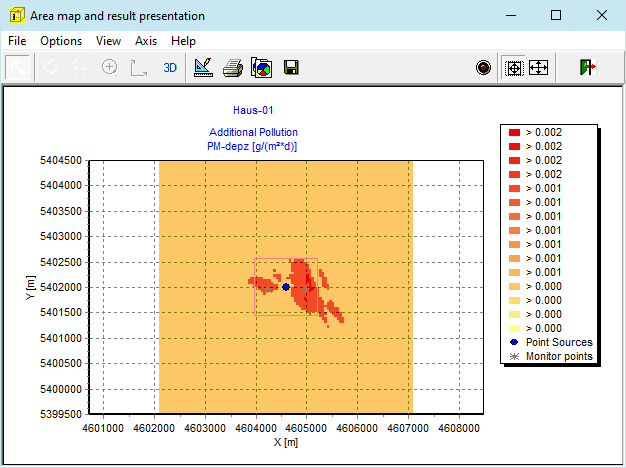
Annual average of the dust deposition
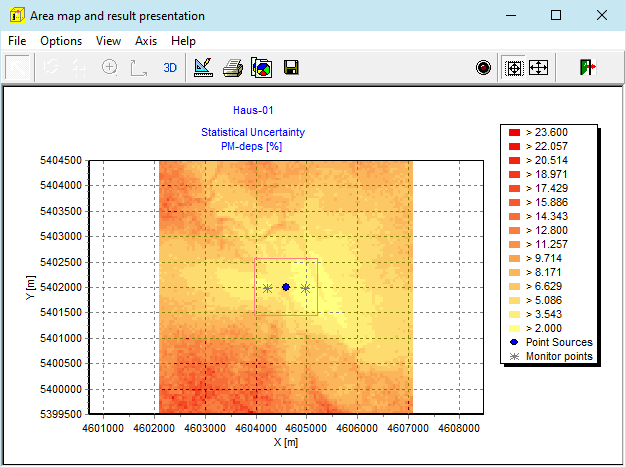
Statistical Uncertainty of the dust deposition
Transparent shapes with a map in the background map
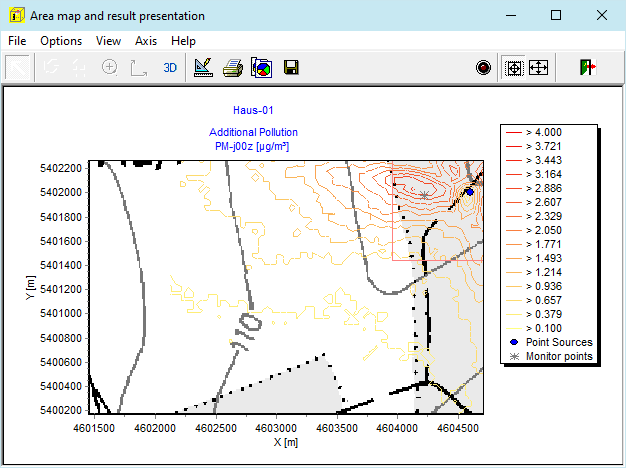
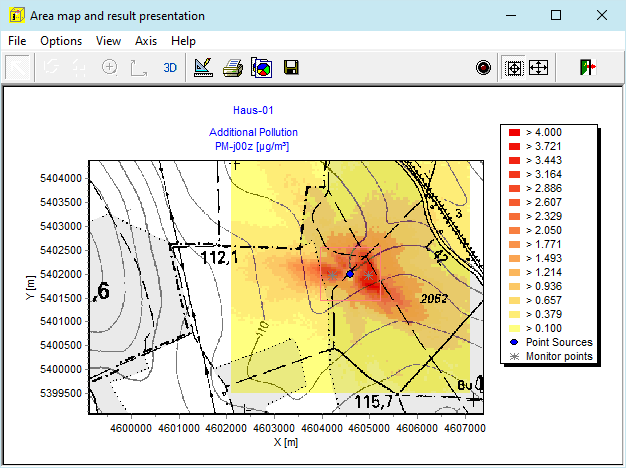
isolines with the background map
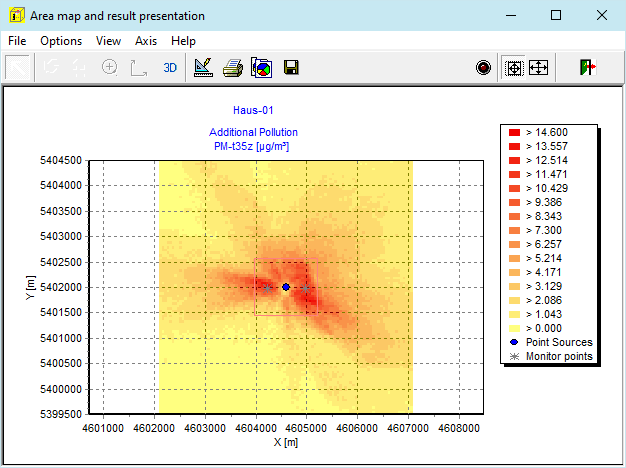
Highest 24 hour average of the dust Concentration with 35 excesses
Usage of externaly generated meteorological Fields
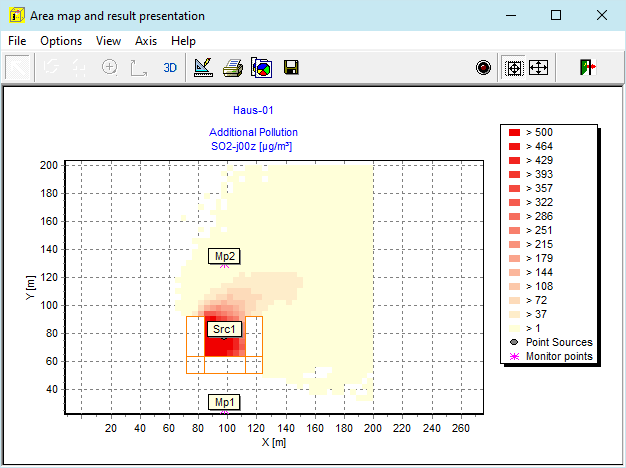
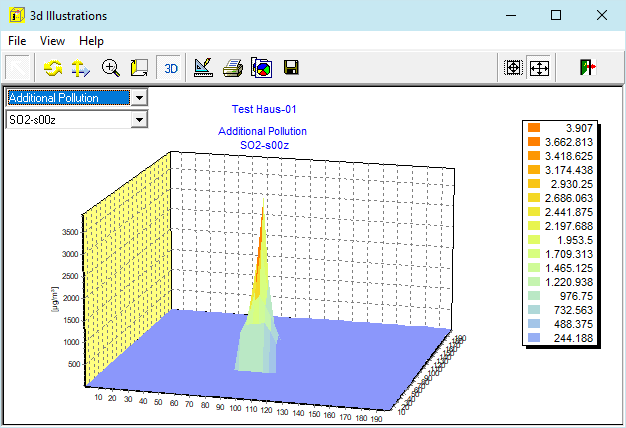
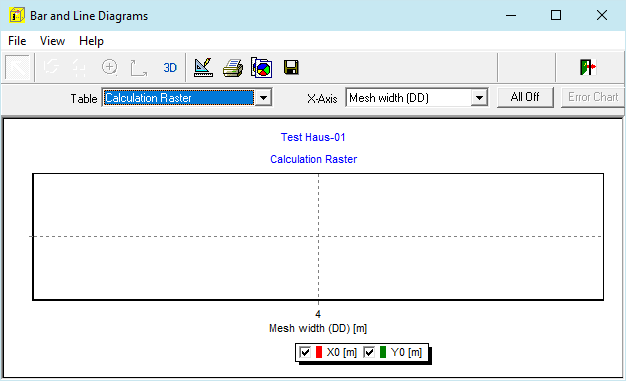
Sample haus-01
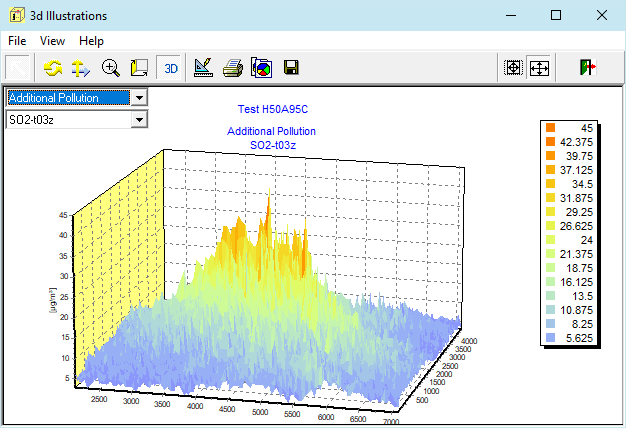
3D-illustrations for SO2
See here for further details about the features of this program part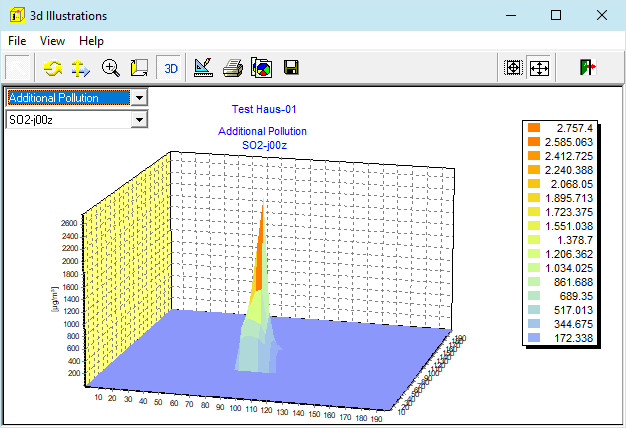
Annual average of the concentration
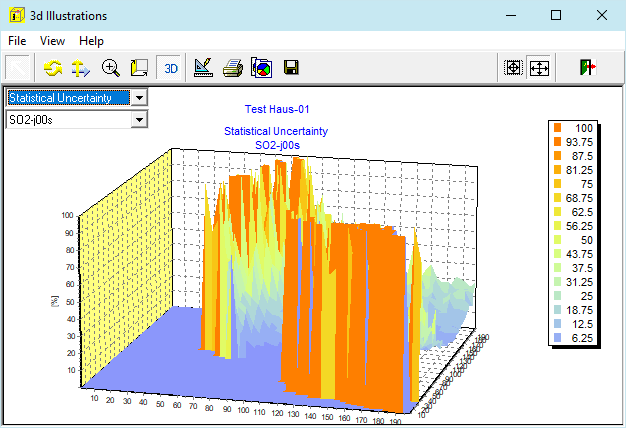
Statistical Uncertainty of the concentration
Highest hour average

Maximum hour average with 24 excesses
Highest 24 hour average
Statistical Uncertainty of the 24 hour average
Maximum hour average with 24 excesses
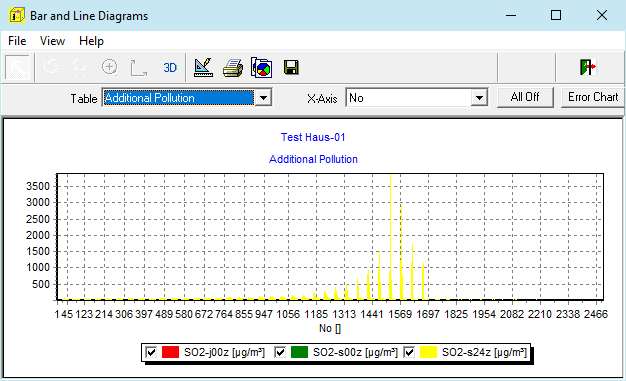
Samples of different bar charts
See here for further details about the features of this program part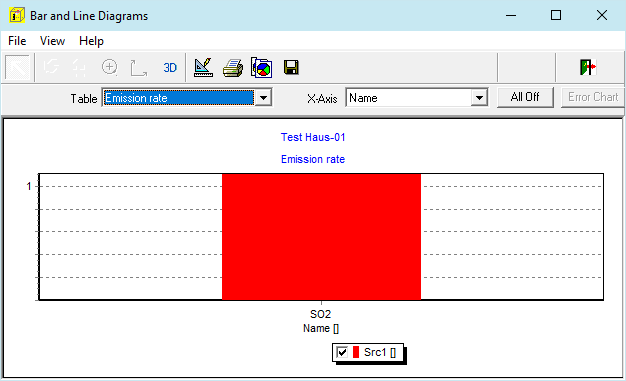
Mass Flowsöme
Evaluation of the time line calculation; Total Pollution
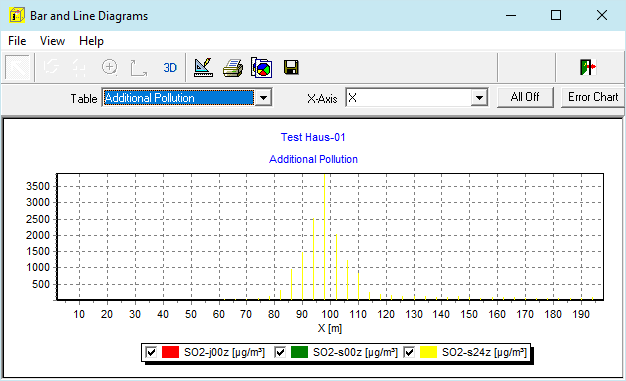
Evaluation of the time line calculation; Additional Pollution
Concentration course at Monitor Point
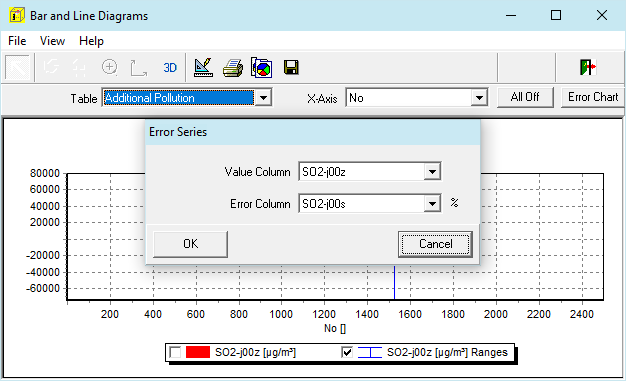
Concentration course with error range
Sample for a terrain illustration
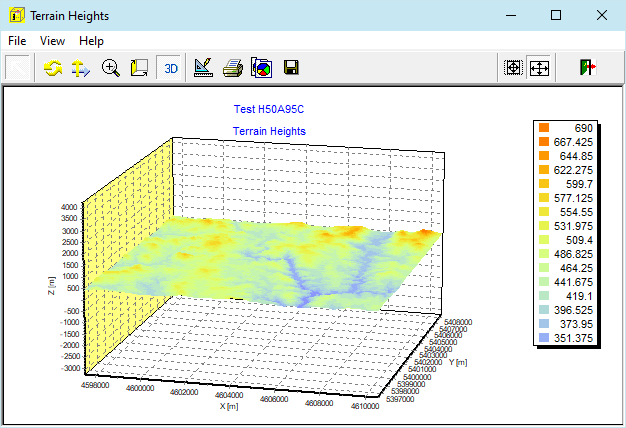
Sample H50A95C