


P&K 3781 (VDI 3781 2)
Program description
Product has been archived / Produkt wurde archiviert
Stack height calculations with regard to rugged terrain
according to the guidelines VDI 3781 and TA Luft
Index
1. Overview
2. Introduction
2.1 Installation
2.2 Files
2.3 Integrated help and manual
3. Stack height according to TA Luft
3.1 List of pollutants
4. Height correction according to VDI 3781
4.1 Correction for the schema
4.2 Terrain profile
4.3 Adaptation calculation
4.4 Output of correction graphic
4.5 Output of correction report
5. Operation
5.1 Within the forms
5.2 Within the tables
5.3 Within the graphics
6. Problem solving and compatibility
7. Glossary
Appendix

1. Overview
With P&K 3781 we offer a PC program to carry out stack height calculations with regard to rugged terrain according to the guidelines
P&K 3781 is organized in two program sections independent from each other.
One program section calculates the stack height corresponding to the "Nomogram for determination of the stack height" (illustration 2) and the "Diagram for determination of the value J" (illustration 3) of
The second program section calculates the stack height for a given terrain profile according to the guideline
For both program sections the input data and the calculation results can be stored in files. The selection of a set of data (Files) or the input of appropriate data is required to access further program functions (main menu item Files). The demo is protected by several blocked entry fields for the stack data.
The results of the calculation can be stored as a report in files or they can be printed.
A graphic of the terrain section and the selected schema also can be printed as well as transferred to other programs.
2. Introduction
2.1 Installation
To install the program, execute the setup program and choose the desired language (in the menu Options) after installation.
The program can be started by executing pk_3781.exe. For simplification a link to a user defined program group has been produced during the installation.
2.2 Files
The parameter settings of a project are stored in a set of files with the same name but with different extensions.
Functions for all necessary file handlings are available in the file manager:
| New | Creates a new project with the name NONAME in which data can be entered. It can be saved under a new project name. |
| Open | In this form, projects can be opened. |
| Save | Saves all files associated with a project. Overwrites without prompting, except when no name is given. |
| Save as | Saves all files associated with a project. The project name can be chosen or entered in a form. If one of the files already exists, the form will ask you if you want to overwrite. |
From Version 6.1 on there is only one binary project file combining all files listed below. Old project files can still be read.
For each TA Luft project a set of files with different extensions and the same name (project name) will be put into the current data path by the file manager and administered there.
| *.HOH | Input data of the height calculation |
| *.SHH | List of the pollutants |
For each "correction" project a set of files with different extensions and the same name (project name) will be put into the current data path by the file manager and administered there.
| *.KOR | Input data for the height correction |
| *.SHP | Terrain profile |
These files are simple ASCII-format text files.
2.3 Integrated help and manual
A context-sensitive help is integrated inside the program. It can be pulled up at any location in the form by pressing the function key "F1". In the help screen, if necessary, highlighted cross references (links) are interspersed, which, by clicking on them, provide more detailed information.
Under App-Config one can override the default Browser with a line like Browser=c:\....\firefox.exe. This is e.g. useful for Wine under Linux.
3. Stack height according to TA Luft
The basis for the calculation of the stack height is the "Nomogram for determination of the stack height" (illustration 2) of TA Luft 2002.
For the given waste gas components a minimum height (H') will be calculated in a pollutant list.
For the pollutant which causes the highest stack height, an additional height for development and/or vegetation in accordance with the "Diagram for determination of the value "J" (illustration 3) of TA Luft 2002, is taken into consideration.
An individual text which appears in the result output (report) of the stack height calculation (according to TA Luft) can be set here.
The exhaust volume rate of the waste gas is to be entered in °C, in standard state after deduction of the dampness content of the steam. The temperature on the stack muzzle is to be entered in °C also.
The lift of the waste gas is determined by the internal diameter of the stack or by the equivalent diameter of the cross-section area.
The average height of the built-up existing development or, according to a development plan permissible development or the vegetation in the farmland (if more than 5 % of the assessment area is concerned), determines the additional height according to the "Diagram for determination of the value J" .
see Form Stack height according to TA Luft and Report
3.1 List of the pollutants
Names, S-value and, as desired, emission mass flux or emission concentration can be entered in a table for the relevant pollutants.
Rows can be inserted or deleted in the table with the function keys of the editor.
The name of a material can be entered or selected from an internal list. Only if a material is selected from the internal list, the related S-value will be set.S-Values are retrieved from a user file or from a file S-Valuesxxxx.txt, where xxxx is 1986 or 2002. These parameters can be set under the menu Options / TA Luft Version.
The concentration of the emitted pollutant material refers to the exhaust volume rate of the waste gas in standard state after deduction of the dampness content of the steam. If the concentration has been set, the emission mass flux will be calculated and vice versa.
Taking account of the waste gas parameters, for each pollutant the minimum stack height will be calculated using the TA Luft-Nomogram.
The greatest height value will be transferred into the form of the waste gas parameters.
see Form List of the pollutants
4. Height correction according to VDI 3781
For the stack height (H) resulting from the first calculation step, based on the topographical facts (if the plant is situated in a valley or the dispersion of the emission is disturbed by terrain elevations), a correction according to the guideline VDI 3781 part 2 might be necessary (TA Luft 86, section 2.4.3 and TA Luft 2002).
With the help of this guideline the stack height for schematized terrains can be calculated. For the adaptation of the actual terrain profile to such a schema, 3 characteristic parameters have to be defined. These parameters can be entered into the form "Heights" manually or they can be ascertained from the program with the help of an adaptation calculation.
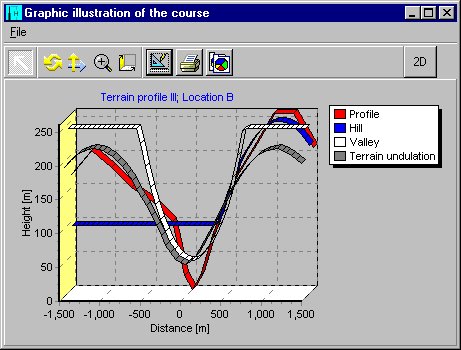
For control and presentation of the calculations, the graphic output of the terrain profile with the adapted terrain schema can be displayed and printed.
The Guideline VDI 3781 Part 1 (August 1981) contains a misprint on page 9 with considerable effects! The values for x/d are transposed in the captions for picture 16 and 17. Picture 16 describes the nomogram for x/d=-1.25 and picture 17 describes the nomogram for x/d=-2. In the draft of the Guideline from April 1979 these facts are described correctly. P&K 3781 is using the correct version.
see Form Correction of the stack height
4.1 Correction of the schema
The x-coordinate of the stack location is to be entered in the system of coordinates which is put into the terrain section arbitrarily. The modification of the location requires a new calculation of the characteristic schema parameter.
The stack height calculated according to TA Luft is available in the program section "TA Luft" and can be imported there together with the plume rise. (Button "Import")
For the 5 possible schematized terrain types, the characteristic parameters (d, a, x0) are to be defined (they will be distinguished between the terraces ascending to the right and to the left). The resulting stack height will be shown.
For the terrain undulation, the characteristic height parameter (a) is a derived value and therefore unsuitable for the input. Therefore, the expression 2*b is used here (different to other schemata) as the height parameter (VDI 3781 section 3.1).
x0 describes the distance of the center of the particular schema from the origin of the coordinates (origin of the coordinates according to section 3.1 of the guideline VDI 3781 Part 2) of the terrain section. Therefore, it is not identical to the characteristic x of the guideline.
For the schema "terrain undulation", there is no instruction in the guideline for the case
The inclusion of a schema into the graphic illustration and the correction report can be set.
Any text can be entered; it will appear in the correction report.
For each schema, the most important interim results of the calculation and the corrected height (HG) will be ascertained.
| beta | Angle of the edge |
| x/d | Stack location |
| hG* | Corrected effective source height |
| HG* | Corrected stack height |
| delta_H | Corrected plume rise |
| HG | New stack height |
If the application of the guideline is improper (either beta or x/d are outside the validity range), all of the following quantities are shown as zero.
see Form Correction of the stack height
4.2 Terrain profile
An arbitrary system of coordinates in x and z-direction (distance and height) is to be set in a vertical terrain section which runs through the stack location.
For the terrain profile, supporting points with sufficient density in ascending x-value are to be entered in the table.
Rows can be inserted or deleted in the table with the function keys of the editor.
see Form Terrain profile and Samples
4.3 Adaptation calculation
For the set terrain schema, an automatic adaptation of one terrain schema to the terrain profile will be executed in the adaptation calculation.
The terrain section, in which the adaptation should occur is to be entered for each schema. The selection of this range can possibly have a great deal of influence on the results. The section should include the terrain structure relevant for the particular schema - including the lateral foothills. If the section is selected on such a large-scale that the terrain schema can't be identified clearly, the adaptation calculation can perform an adaptation to an incorrect structure.
The adaptation curves are to be set so that they always intersect with the stack location.
The number of the adaptation steps determine the accuracy of the adaptation. The adaptation of a terrain schema to the actual terrain profile takes place in a chain of adaptation calculations which are composed of each other and get more accurate with every step. The more adaptation calculations are accepted, the more accurate the result will be at the expense of the execution time.
Using 6 steps for the characteristic parameters (a, d and x0) an accuracy of 0.8 % of the expansion of the terrain profile is achieved; by 9 steps an accuracy of 0.1 % is achieved (e.g. with the 6 steps of a profile section of 1000 m and a height difference of 100 m the parameters d and x0 are ascertained to 8 m accurately and the parameter a to 0.8 m accurately).
see Form Parameters of the profile adaptation
4.4 Output of the correction graphic
Under the menu item "Graphic" the terrain profile, set in the table, and the schema, set in the form "Heights", are graphically illustrated.
see Graphic sample
4.5 Output of the correction report
Inputs and calculations of the program branch "Correction" can be printed.
The characteristic parameters, the interim results derived from them and the resulting stack height are listed for the terrain schema in the form "Heights".
The highest stack height of a connected schema is to be entered into the report as "corrected stack height".
| x | Stack location regarding the center of the schema |
| a | Structure height |
| d | Structure width |
| beta | Edge angle |
| lambda | |
| x/d | Relative stack location |
| HE/a | Relative stack height |
| hE/a | Relative effective source height |
| K | Correction factor for the stack height |
| k | Correction factor for the effective source height |
| HG* | Corrected stack height |
| hG* | Corrected effective source height |
| delta_H | Corrected vitiated air plume rise |
| HG | New stack height |
All these characteristics are defined under identical names in the guideline and described there.
If the application of the guideline is improper (either beta or x/d are outside the validity range), HG will be indicated as "improper".
see Report
5.0 Operation
5.1 Within the forms
In the forms, the entries are made in form fields. With the keys Cursor up, Cursor down, Tab and Shift Tab or with the mouse the cursor can be moved over the fields. Cursor left and cursor right move the cursor character by character within a field.
Real numbers can be entered with a period or comma or as 1e-6 for 10-6. The error tone can be ignored on input, it is only triggered as a warning because 1e or 1e is not a valid number.
Posibly (if marked in the form) a selection list of discrete input values can be opened.
F1 provides context-sensitive help for a form field or the entire form and the integrated manual is accessible.
Click OK or CANCEL to leave the current form.
Also see: Calculator
5.2 Within the tables
The order and the width of all columns can be changed by clicking into a column header or between column headers and dragging as desired. This is practical if values are in a particular order, because Tab has to be pressed just once in order to reach the next column.
If the data in the columns are too wide to be displayed, then the symbols (in brackets) will be hidden in the column titles (e.g. Temperature (T0) ). Widening of the column will show that particular symbol.
The buttons "+" and "-" are used to insert or delete data sets. With the button "Dup" the current data set can be duplicated. The new row will become the last row in the table. This is useful if a data set is to be generated with minor difference to the current one. To insert a row, select the lower gray row before pressing the "+" button.
Individual fields, in which a selection is possible, are marked yellow. To activate the selection click once in a cell in order to select this; click a second time in order to activate the selection (no doubleclick).
With the cursor or Tab key, the focus can be moved between individual fields.
The illustrated section can be scrolled one row up or down by moving the cursor across the upper or lower edge of the table form.
Some tables can be sorted. With a right mouse button click into the considerable column, a Pull-Down Menu will be opened, and Sort Ascending or Sort Descending can be selected.
In some tables, a Row-Editor can be invoked. The Row-Editor shows one dataset only and can have more or less features then the grid dialog.
Sometimes single Columns can be imported via the Popup Menu. From the selected file, the values are taken and written to the position, from which the dialog was invoked. One value will be read per line from an ASCII file (includes CSV format) .
Sometimes single Columns can be imported via the Popup Menu. From the selected file, the values are taken and written to the position, from which the dialog was invoked. One value will be read per line from an ASCII file (includes CSV format) .
Some tables feature a search function. See Find in table
See: Calculator and Alter Column Values.
Filter
This feature allows to filter out a column with its value. Only rows with this value in the filtered column and not this column will be shown. The filter can be set to most of the columns (except when they are declared unique). All available column names are shown in the selector next to "Filter:". Once a column is selected, a corresponding value out of this column can be selected in the selector to the right of the equal sign. Filtering is accomplished on a text basis rather than on a value basis (e.g. 1.0 doesn't equal 1).
Using the filter feature will reorder the rows. Only columns, which are not defined as unique, can be selected. Some table can be sorted (Right Mouse Button Click into the column of regard.)
A filter might be active during import / export to exclude or include rows of data.
Table Import and Export
In most tables, data can be imported or exported with the buttons in the tool bar. The sequence of the columns and which columns are used, depends on the current column order and the current filter setting. With a button in the tool bar, a form can be opened which gives information about the current settings.
Single Columns can be imported via the Popup Menu. From the selected file, the values are taken and written to the position, from which the dialog was invoked. One value will be read per line from an ASCII file (includes CSV format) .
Available formats for import and export
| CSV | Columns are separate by commas (Comma Separated Values). If a text contains commas, it must be written in " " (Quotation marks). The decimal character is the point. Values can optionally contain an exponent (e.g.: 6.E-9), however no additional separators are allowed. |
| TXT | Columns are separated by spaces. If a text contains spaces, it must be written in ' ' (Apostrophe). The decimal character is the point. Values can optionally contain an exponent (e.g.: 6.E-9), however no additional separators are allowed. |
| Current Project Extension | Individual tables can be loaded from project files. The loaded table must fit logically into the project. The export creates a new project file, which contains only the exported table. |
| * | On selection of the file type [With Options (*.*)], the form Table Import Options will be opened, in which further parameters are available. |
The formats can be selected in the appropriate dialogs under the type of file. The filter function is switched off for other formats than CSV, TXT and *!
Preview
The tables can be viewed appealingly as an HTML-file by using the preview function. see Report function.
Also see: Calculator
5.3 Within the graphics
Most of the graphics can be zoomed; therefore a rectangle has to be opened with the mouse from the upper left corner to the lower right corner. To reset the zoom, a rectangle from the lower right corner to the upper left corner has to be opened with the mouse. Also the graphic can be moved; therefore the graphic is to be dragged with the right mouse button pressed.
Some dialogs can also be opened by clicking onto the axis, the legend, the title or double clicking the drawing area.
The button ![]() has to be down for all functions, which are activated by clicking into the drawing area.
has to be down for all functions, which are activated by clicking into the drawing area.
Graphical illustrations on the screen can be printed with File/Print or the button ![]() .
.
The Export of Images can be done with ![]() . Images can also be copied to the clipboard with
. Images can also be copied to the clipboard with ![]() .
.
 Setup (Layout, Export and Format)
A form in which more graphic parameters can be set. Functions for export and graphics formats are also in this form.
Alterations made in ![]() will not be saved automatically. In some illustrations it might be possible to save and load configuration changes under the file menu, but it might cause strange effects, because the configuration might not fit to the current illustration. Series, which are not needed in the current illustration and which are not automatically destroyed can be made inactive. Data are managed in so called Series. The configuration can be saved with or without data. The data are normally replaced with the current ones, despite this, sometimes it might still be important to save the data along with the configuration.
will not be saved automatically. In some illustrations it might be possible to save and load configuration changes under the file menu, but it might cause strange effects, because the configuration might not fit to the current illustration. Series, which are not needed in the current illustration and which are not automatically destroyed can be made inactive. Data are managed in so called Series. The configuration can be saved with or without data. The data are normally replaced with the current ones, despite this, sometimes it might still be important to save the data along with the configuration.
Modifications and settings in other forms or of the calculated data can overwrite made changes in Setup!
It is recommended to set the graphic type to the configuration to be loaded.
 MAX
MAX
With the button MAX the scale settings are maximized.
 ISO
ISO
The graphic can be illustrated isometrically by using the button ISO. This has to be repeated after changing the size of the graphic.
6.0 Problem solving and compatibility
Compatibility to previous versions
The program can read the files from previous versions, but files produced by this program can only be partially processed by the predecessors.
Hints
If the hints disappear too fast, a value for "HintHidePause" can be set in the file P&K.ini (in the program directory). E.g. "HintHidePause=2500" means, the hint remains visible for 2.5 sec., if no other actions with the mouse were made.
7.0 Glossary
| VDI | Verein Deutscher Ingenieure (The Association of German Engineers) |
| TA Luft | Technische Anleitung zur Reinhaltung der Luft (Technical instructions for air quality management) |